Tan Teik Jun - Project Portfolio
Project: Study Buddy
Overview
StudyBuddy is a desktop application designed for students who wish to manage their module related tasks in a convenient and user-friendly interface. The application is written in Java and spans over 12k lines of code.
Summary of contributions
-
Major enhancement: added Productivity feature
-
Function: It allows the user to keep track of productivity in a fun manner. The productivity feature displays metrics that are recorded over the past day, week, and more. It also introduces a point and rank system to gamify the user experience.
-
Justification: This is helpful to the user as it allows the user to keep track of progress in an interesting way.
-
Highlights: This implementation was challenging because it required a lot of statistics to be logged all over the application. Finally, these statistics needed to be displayed on the Ui in an visually appealing and useful manner.
-
-
Major enhancement: added the Edit Task command
-
Function: The edit command allows the user to edit any information about the tasks. This includes the task name, date, description, etc.
-
Justification: If the user needs to edit the detail of the task, the user can simply use the edit command instead of deleting the task and creating a new one. This is hugely convenient for the user.
-
Highlights: This implementation was challenging because editing things may lead to a lot of side effects. However, I have managed to avoid these side effects by using defensive programming.
-
-
Minor enhancement: added the Find Task command
-
Function: Allows user to find an existing task in the list
-
Justification: Helpful to the user when the list is long because it enables them to look for a certain task in the list.
-
-
Minor enhancement: added the List command
-
Function: Allows user to list all the existing tasks.
-
Justification: After using a command like Find or Filter, the List command is necessary to recover the original list.
-
-
Minor enhancement: added the Help command
-
Function: Shows the user the list of available commands and the user guide.
-
Justification: Users require the help command when they are unsure of how to use the application.
-
-
Minor enhancement: added navigation shortcuts for pages
-
Function: Allows user to navigate the pages using keys instead of using
-
Justification: This feature helps fast typists (the target user) work more efficiently.
-
Team-based Tasks
1. Set up the team repository and ensured that the repository was protected from any accidental merges.
2. Ensured that the integration process was smooth and bug-free. Set up Travis and AppVeyor to ensure that only working code is integrated.
3. Ensured code quality was well-maintained. Set up Codacy to keep track of code quality and coverage.
4. Ensured that the code was well-tested. I wrote tests for classes that were error-prone, and set up Coveralls to keep track of code coverage.
5. Helped to maintain the issue tracker. Links to issues #46, #47.
Review/Mentoring
1. Reviewed other members Pull Requests and helped them learn git workflow. Example Pull Request: #56
2. Reviewed another team’s DG and provided useful feedback. Example Issue: #209
User guide
Given below is a section that I contributed to the User Guide. It showcases my ability to write documentation targeting end-users. |
Productivity
(Contributed by Teik Jun)
The productivity page shows insights related to your productivity over the past day, week and more. By keeping tabs on your past productivity, you can improve your future productivity. The productivity feature also gamifies your task management experience. Doing work has never been more fun!
Daily Productivity Tab
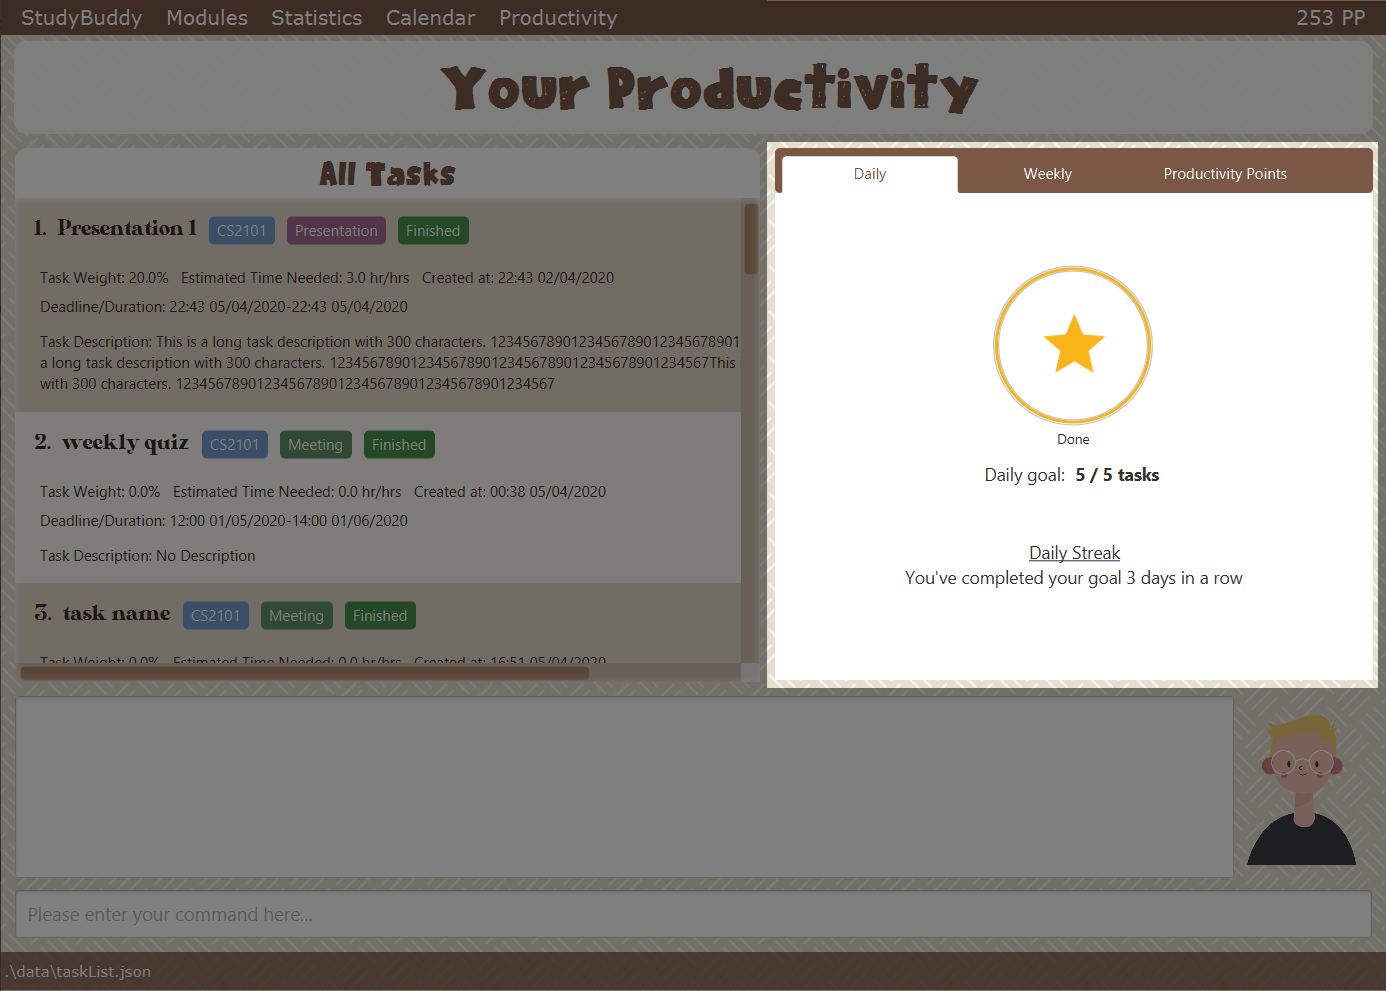
To get started, click on the Productivity menu button or type F6.
The daily productivity tab tracks the number of tasks you completed today.
As you complete tasks using the done command, you will get closer to your daily goal.
Completing your goal each day adds to your streak. Your streak will reset to zero if you fail to complete your goal.
You can set a daily goal for the number of tasks you want to complete using the command goal.
Refer to [Goal] for more details on the goal command.
Note that the streak can only be increased once a day,
even if you change your goal after completing your streak.
|
Weekly Productivity Tab
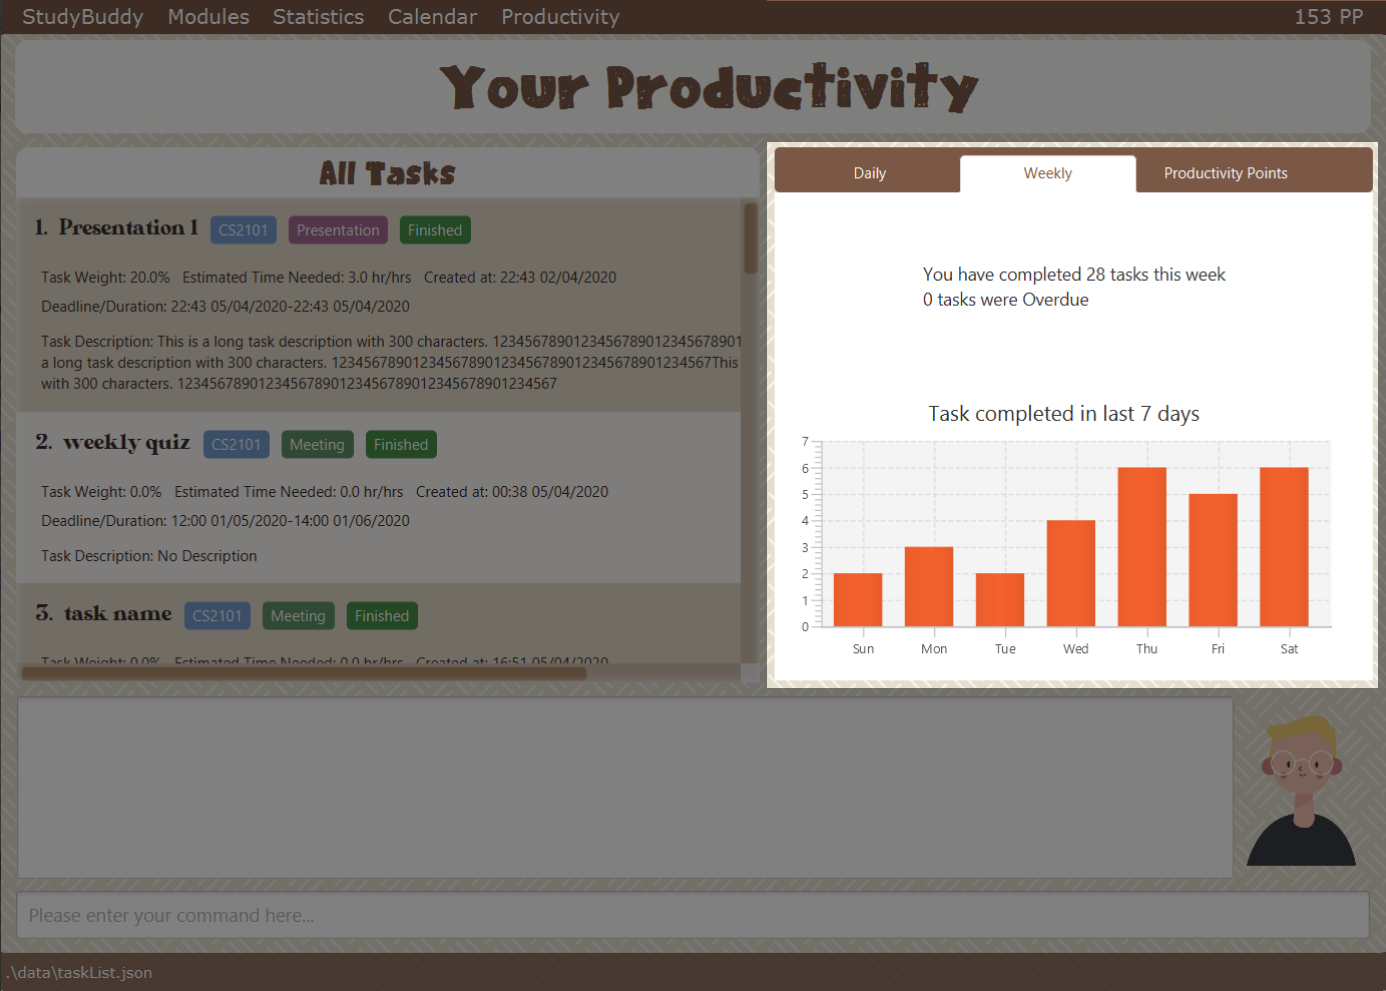
On the weekly productivity tab, you can look back on your progress over the past week. The weekly tab displays information about your productivity for the past seven days.
Here, you can keep track of the total number of tasks you completed this week. You can visualize the number of tasks you completed using the bar chart shown.
Furthermore, you can keep track of the number of tasks that went overdue this week, so that you can be more punctual in the future.
| If you complete or add a task while looking at the weekly tab or productivity points tab, the color theme changes randomly. |
Productivity Points Tab
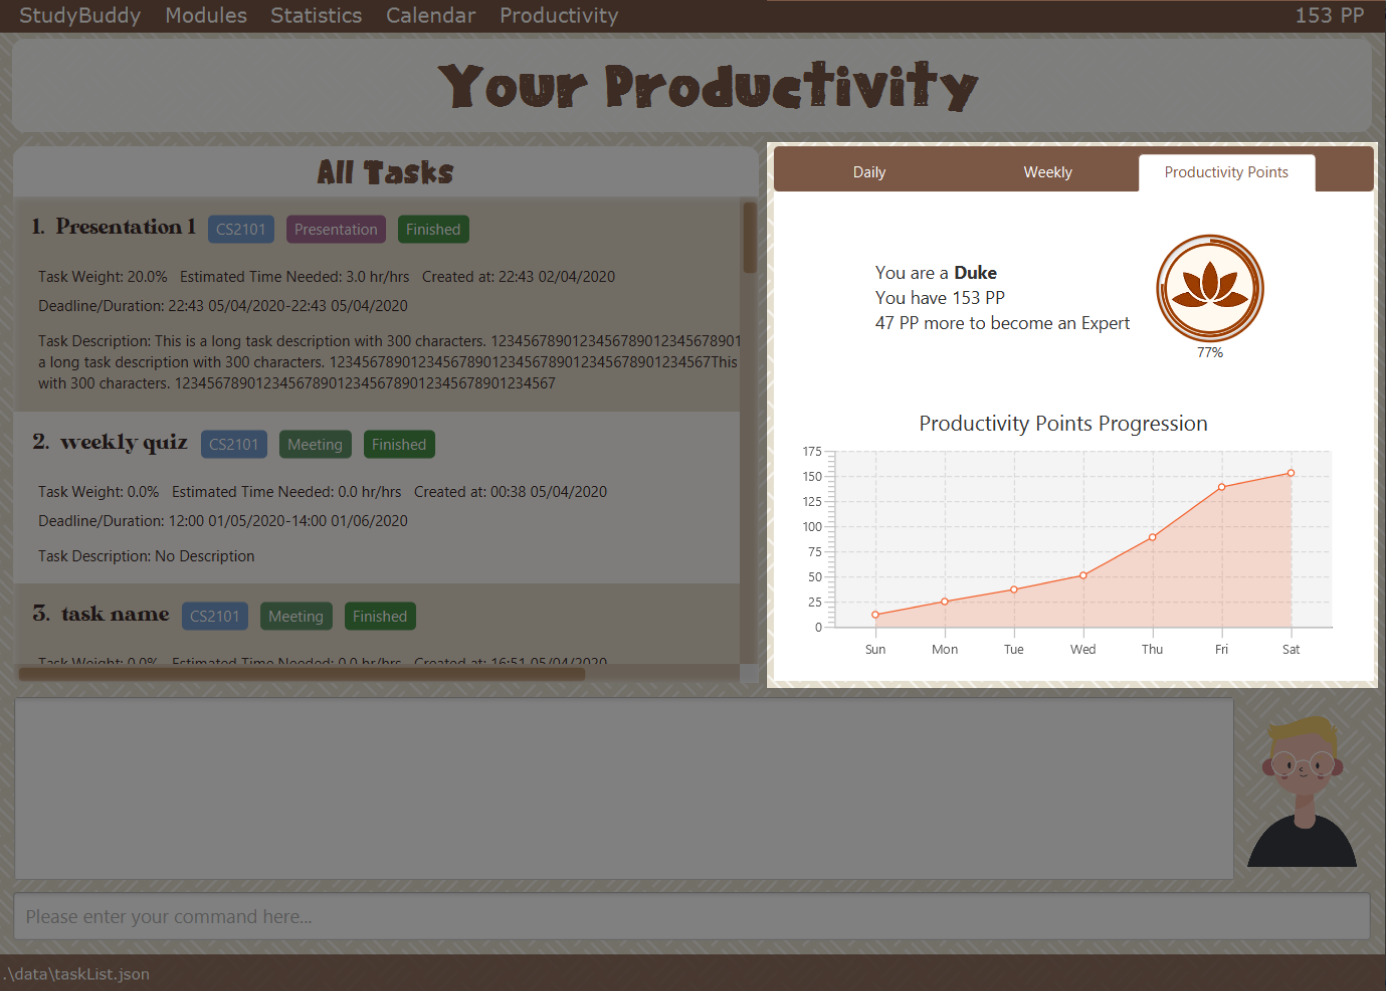
You can go to this tab directly by clicking your Productivity Point count on the top right of the menu. The Productivity Points tab displays your current Productivity Points (PP) and your progression.
You gain Productivity Points upon adding tasks, completing tasks, and using advanced features in StudyBuddy. On the other hand, you lose Productivity Points when your tasks go Overdue.
Here are some examples of how to obtain Productivity Points in StudyBuddy:
-
Adding a task: +1
-
Completing a task: +10
-
Completing your daily goal: +(points equivalent to daily goal)
-
Using advanced features; +1 (Explore StudyBuddy to find out more!)
-
Letting a task go Overdue: -1
| You start with some productivity points. They’re free! :) |
Developer Guide
Given below are some sections I contributed to the Developer Guide. They showcase my ability to write technical documentation and the technical depth of my contributions to the project. |
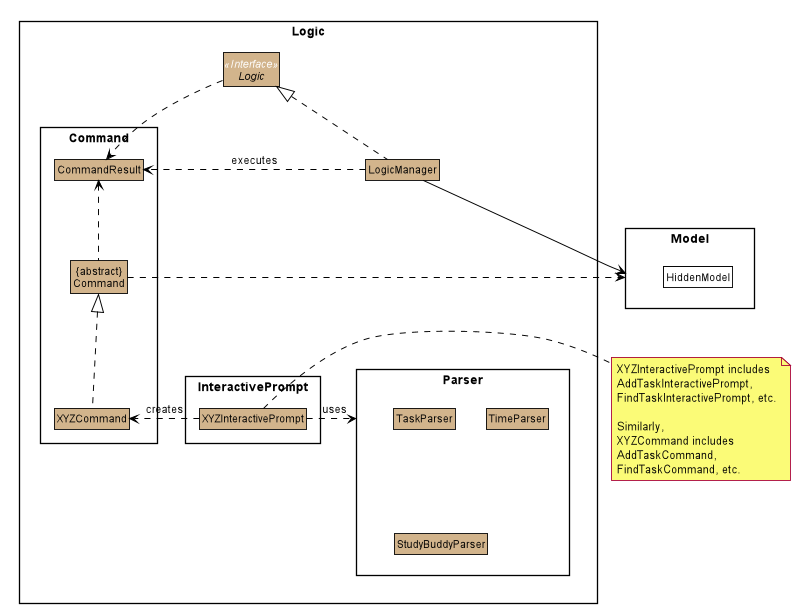
Logic component
API :
Logic.java
-
After receiving the user input from Ui,
InteractivePromptprocesses the user’s input.-
If the user input is complicated,
InteractivePromptusesParserclasses to parse the input. -
If more information is needed from the user,
InteractivePromptsignals theUicomponent to prompt the user for more information using theinteractcommand. Otherwise, if no more information is needed, proceed to the next step.
-
-
This results in a
Commandobject which is executed by theLogicManager. -
The command execution can affect the
Model(e.g. adding or editing a task). -
The result of the command execution is encapsulated as a
CommandResultobject which is passed back to theUi. -
In addition, the
CommandResultobject can also instruct theUito perform certain actions, such as displaying a help message to the user.
Given below is the Sequence Diagram for interactions within the Logic component for the interact("list") API call.
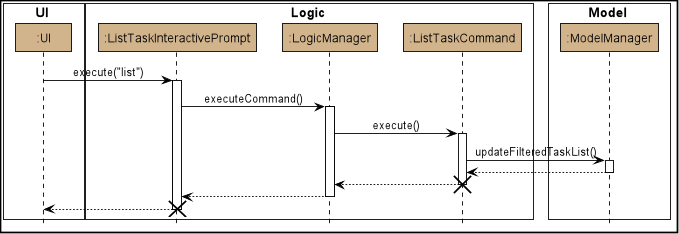
| The lifeline for every member should end at the destroy marker (X) but due to a limitation of PlantUML, the lifeline reaches the end of diagram. |
Productivity feature
Implementation
The productivity feature displays insights related to the user’s productivity over the past day, week and more on the Productivity panel. The Productivity page is integrated with the main page as a side panel.
The Productivity page is further composed of 3 tabs:
-
Daily Productivity Tab
-
Weekly Productivity Tab
-
Productivity Points Tab
The Productivity page can be viewed by clicking on the Productivity menu item, which directs the user to the Daily Productivity Tab. The Productivity page can also be viewed by clicking on the Productivity Points shown on the top right of the application window. This directs the user to the Productivity Points Tab.
The productivity feature is facilitated by the Statistics class, which allows
StudyBuddy to keep track of relevant usage statistics of the user.
Statistics is further composed of classes that keep track of specific statistics:
-
CompletionStatskeeps track of the number of tasks completed by the user each day and each week -
OverdueStatskeeps track of the number of tasks that went overdue each day and each week. -
ScoreStatskeeps track of the user’s Productivity Points and rank each day -
GeneralStatskeeps track of the user’s goal, streak, and other statistics not covered by the other statistics classes
The object diagram for the Productivity feature is shown below:
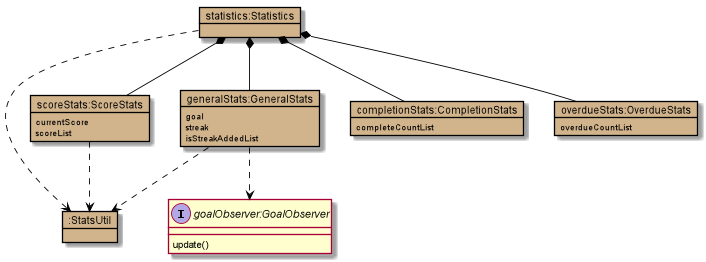
The Productivity feature displays the Producitivity Points of the user, this is recorded in currentScore
and scoreList attributes in ScoreStats class.
The user can gain or lose Productivity Points in StudyBuddy when certain actions or events are completed. These include:
-
Adding a task: +1
-
Completing a task: +10
-
Completing your daily goal: +(points equivalent to daily goal)
-
Using advanced features; +1
-
Letting a task go Overdue: -1
Each usage statistic is updated accordingly when the respective user action or event
has concluded. These statistics are then rendered on the ProductivityPanel.
The chart visualizations are implemented using ProgressIndicator, BarChart and AreaChart.
When the statistics are updated, the task list’s event listener and classes implementing
GoalObserver will be informed of the changes. ProductivityPanel re-renders the
displayed information when either of these are updated.
The data displayed will be automatically updated upon calling any of the following commands:
-
add -
done -
delete -
refresh -
goal -
Any command that modifies the task list
Example Use Scenario
Given below is an example usage scenario and how the Productivity feature behaves at each step.
Step 1: The user launches the application.
Step 2: The Productivity feature displays the user’s Productivity Points on the top right of the screen.
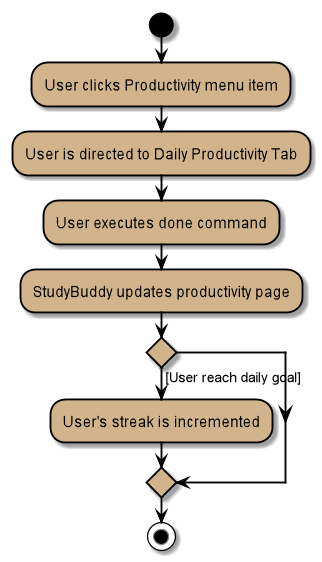
Step 3: The user clicks the Productivity Menu button
Step 4: The Daily Productivity Tab is displayed to the user
Step 5: The user completes a task using done
Step 6: The daily number of tasks is added and Productivity Points is increased.
If the daily goal has been reached, the user’s streak is incremented.
Here is an activity diagram of the aforementioned steps:
Extension: Suppose the user sees the Productivity Points and clicks it Step 3: The user clicks the Productivity Points on the top right of the screen Step 4: The Productivity Points Tab is displayed to the user
From here, the user can continue to manage tasks as per Step 5 and 6 above, or navigate to other Productivity tabs.
Design Considerations
Aspect: How to re-render Productivity Panel when statistics are updated
Alternative 1: re-render only the values that have been updated
-
Pros: maximizes loading speed and minimizes lag for the user
-
Cons: increases complexity for codebase, higher chance of bugs occuring
Alternative 2: always re-render the whole Productivity Panel
-
Pros: easy to implement
-
Cons: may result in slower loading speed and more lag for the user
Alternative 3 (current choice): re-render only the values that have been updated if it does not result in increased code complexity
-
Pros: improves loading speed and decreases lag for the user, while keeping the codebase readable and easy to reason with.
-
Cons: may result in slower loading speed. However, based on testing, this trade-off does not result in any measurable delay.